 BitcoinBTC
$80,857
24h+0.82%7d−2.8%
Your daily crypto brief: prices, sentiment and headlines in one place.
$2.73T
−1.8%from yesterday
The total crypto market cap stands at $2.73T (−1.8% in 24 hours), with $63.15B traded over the same period. Bitcoin dominance is 59.4% and Ethereum’s share is 10.5%; 70 of the top 100 coins are green, signalling broad strength. The Fear & Greed Index reads 51 (Neutral), up 3 from yesterday. Among larger coins, Bitway (+49.2%) leads the board while Quack AI (−72.7%) lags.
51/100
Neutral59.4%Bitcoin
Largest coins excluding stablecoins · tile size reflects market cap · hover, tap or focus a tile for details
BitcoinBTC EthereumETH
 BNBBNB
 XRPXRP
 SolanaSOLBitcoinBTCEthereumETHBNBBNBXRPXRPSolanaSOLBitcoinBTCEthereumETHBNBBNBXRPXRPSolanaSOL
 BTWBitway$1.74+49.2%
 PONSPons$0.2855+16.7%
 PEPEPepe$0.000004900+13.0%
 GRASSGrass$0.7632+11.7%
 ZAMAZama$0.0775+8.8%
 ZECZcash$1,308+5.7%
 NIGHTMidnight$0.0421+5.2%
 QQuack AI$0.0544−72.7%
 AKEAkedo$0.0232−24.6%
 CAKEPancakeSwap$2.08−3.1%
 RAYRaydium$1.78−2.0%
 SKYSky$0.0659−1.8%
 QNTQuant$198.76−1.7%
 SSonic$0.0463−1.7%
 SUISui#30+1.9%
 HYPEHyperliquid#11+4.2%
 PENGUPudgy Penguins#113+3.9%BTCBitcoin#1+0.8%
 PEARLPearl#96−4.8%BTWBitway#41+49.2%
 QTCQuantus#756+1.2%
Movers: coins with at least $150M market cap and $15M daily volume, stablecoins excluded.
| # | Coin | Price | 1h | 24h | 7d | Market cap | Volume (24h) | Last 7 days |
|---|---|---|---|---|---|---|---|---|
| 1 | BitcoinBTC | $80,857 | −0.21% | +0.82% | −2.78% | $1.63T | $24.32B | |
| 2 | EthereumETH | $2,353 | −0.21% | +1.11% | −4.24% | $287.49B | $9.44B | |
| 3 |  TetherUSDT | $0.9988 | 0.00% | 0.00% | −0.05% | $181.60B | $42.35B | |
| 4 | BNBBNB | $744.91 | −0.23% | +0.08% | +0.23% | $97.96B | $900.2M | |
| 5 | XRPXRP | $1.33 | −0.20% | +2.16% | −0.54% | $84.52B | $1.48B | |
| 6 |  USDCUSDC | $0.9994 | 0.00% | 0.00% | −0.05% | $71.12B | $10.41B | |
| 7 | SolanaSOL | $101.55 | −0.08% | +0.78% | −4.94% | $59.91B | $1.98B | |
| 8 |  TRONTRX | $0.3311 | −0.03% | +0.52% | −0.06% | $31.46B | $379.4M | |
| 9 |  Figure HelocFIGR_HELOC | $1.03 | +0.06% | −0.60% | +0.51% | $26.43B | $100.4M | |
| 10 | ZcashZEC | $1,308 | −0.72% | +5.69% | +3.43% | $22.25B | $813.1M | |
| 11 | HyperliquidHYPE | $81.90 | +0.72% | +4.25% | +1.79% | $18.22B | $738.7M | |
| 12 |  DogecoinDOGE | $0.0792 | −0.10% | +1.71% | −3.45% | $12.39B | $447.7M | |
| 13 |  MoneroXMR | $598.98 | −0.38% | −1.66% | +0.92% | $11.27B | $111.8M | |
| 14 |  USDSUSDS | $0.9998 | 0.00% | −0.01% | −0.12% | $9.96B | $103.2M | |
| 15 |  WhiteBIT CoinWBT | $77.64 | −0.20% | +0.75% | −4.43% | $9.22B | $70.4M | |
| 16 |  ChainlinkLINK | $11.62 | +0.04% | +2.19% | −6.04% | $8.91B | $245.9M | |
| 17 |  LEO TokenLEO | $9.05 | −0.01% | +0.19% | +0.03% | $8.32B | $173,482 | |
| 18 |  CardanoADA | $0.2066 | −0.02% | +0.43% | −8.07% | $7.76B | $193.2M | |
| 19 |  NEAR ProtocolNEAR | $4.69 | −0.22% | +4.21% | −5.22% | $6.15B | $537.2M | |
| 20 |  StellarXLM | $0.1717 | +0.11% | +1.43% | −6.31% | $6.05B | $103.2M | |
| 21 |  Bitcoin CashBCH | $295.49 | −0.49% | +4.29% | +4.05% | $5.94B | $216.1M | |
| 22 |  RainRAIN | $0.007194 | −0.19% | −0.17% | −24.86% | $5.11B | $16.5M | |
| 23 |  Ethena USDeUSDE | $0.9991 | 0.00% | +0.03% | −0.06% | $4.56B | $27.4M | |
| 24 |  DaiDAI | $0.9997 | −0.02% | 0.00% | −0.04% | $4.52B | $121.2M | |
| 25 |  LitecoinLTC | $57.33 | 0.00% | +1.13% | −7.14% | $4.46B | $182.4M | |
| 26 |  UniswapUNI | $7.09 | +0.15% | −1.03% | −4.62% | $4.43B | $224.3M | |
| 27 |  AvalancheAVAX | $9.01 | +0.09% | +1.11% | −8.02% | $4.00B | $208.3M | |
| 28 |  CantonCC | $0.0996 | +0.02% | +0.53% | −5.56% | $3.98B | $9.7M | |
| 29 |  USD1USD1 | $0.9988 | 0.00% | +0.01% | −0.03% | $3.90B | $775.5M | |
| 30 | SuiSUI | $0.9349 | −0.11% | +1.91% | −9.50% | $3.85B | $267.8M | |
| 31 |  Gram (prev. Toncoin)GRAM | $1.23 | +0.10% | +2.13% | −8.73% | $3.49B | $28.1M | |
| 32 |  HederaHBAR | $0.0763 | −0.16% | −1.21% | −9.94% | $3.38B | $71.8M | |
| 33 |  Tether GoldXAUT | $4,048 | −0.01% | +0.87% | −1.43% | $3.27B | $200.9M | |
| 34 |  Global DollarUSDG | $0.9997 | 0.00% | −0.02% | −0.06% | $3.12B | $427.8M | |
| 35 |  PayPal USDPYUSD | $0.9999 | −0.01% | +0.01% | −0.11% | $3.03B | $26.8M | |
| 36 |  BittensorTAO | $257.23 | +0.17% | +2.68% | −6.47% | $3.00B | $95.9M | |
| 37 |  Shiba InuSHIB | $0.000004940 | −0.07% | +1.22% | −4.52% | $2.91B | $52.8M | |
| 38 | QuantQNT | $198.76 | −0.13% | −1.74% | +2.17% | $2.89B | $85.3M | |
| 39 |  EthenaENA | $0.2093 | +0.59% | +0.31% | +7.16% | $2.81B | $456.9M | |
| 40 |  CronosCRO | $0.0540 | −0.73% | +1.34% | −6.87% | $2.74B | $5.5M | |
| 41 | BitwayBTW | $1.74 | −0.44% | +49.15% | −14.54% | $2.62B | $15.8M | |
| 42 |  Ripple USDRLUSD | $1.00 | 0.00% | 0.00% | −0.03% | $2.62B | $194.0M | |
| 43 |  MemeCoreM | $1.07 | +0.90% | +13.49% | +39.15% | $2.44B | $2.3M | |
| 44 |  Ondo US Dollar YieldUSDY | $1.15 | −0.01% | +0.05% | +0.14% | $2.38B | $3.8M | |
| 45 |  Circle USYCUSYC | $1.14 | 0.00% | +0.01% | +0.07% | $2.38B | $0 | |
| 46 |  OKBOKB | $109.79 | −0.06% | +0.46% | −5.20% | $2.31B | $12.7M | |
| 47 |  BlackRock USD Institutional Digital Liquidity FundBUIDL | $1.00 | 0.00% | 0.00% | 0.00% | $2.20B | $0 | |
| 48 |  AaveAAVE | $134.52 | −0.01% | −0.52% | −13.41% | $2.08B | $258.4M | |
| 49 | PepePEPE | $0.000004900 | +0.07% | +13.05% | +0.84% | $2.06B | $348.5M | |
| 50 |  OndoONDO | $0.4219 | −0.01% | +2.32% | −7.18% | $2.05B | $82.7M |
No coins match your search.
The index blends volatility, momentum, social media activity, surveys and dominance into a 0–100 score. Extreme fear can mark buying opportunities; extreme greed often signals a market due for a correction. It is a mood gauge, not a prediction.
+$110.3Mnet · Mon 26 Oct
Net buying≈ +1,384 BTC
On Mon 26 Oct, US spot Bitcoin ETFs took in a net $110.3M (about 1,384 BTC). Over the last 5 sessions the funds shed a net $111.5M, and over the last 20 sessions shed a net $284.6M. Since January 2024 cumulative net inflows total $57.26B.
Net flow per trading session · last 30 sessions
Net flow per week, Monday to Friday · last 26 weeks
Net flow per calendar month · last 24 months
US$ millions: shares created minus shares redeemed across all US spot Bitcoin ETFs, per US trading day; BTC figures divide each day by its BTC price. Data: TFTC (CC BY 4.0), compiled from SoSoValue and Farside Investors; weekly and monthly totals are summed here. Smaller funds sometimes report a day late, so the newest session can still be revised.
Headlines from leading outlets. Each card links to the original article.

Discord conversations on large public servers will soon reach audiences far beyond their communities, raising privacy concerns.
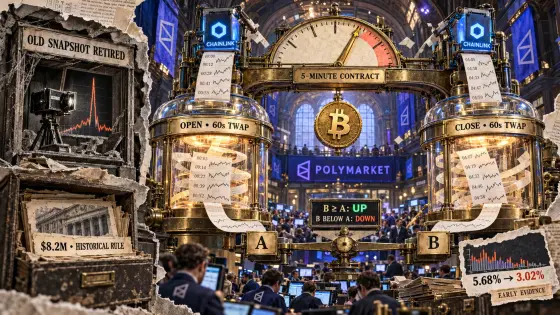
A newer study finds the earlier Binance trading pattern subsided after averaging, but historical wallet gains cannot quantify current losses. Read the full story on CryptoSlateUnderstand the crypto stories…
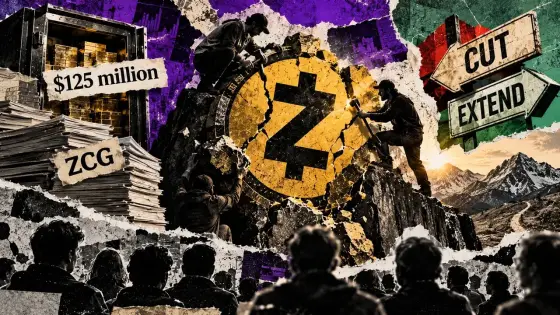
Zcash faces competing proposals to scrap or extend developer subsidies as growing investor interest swells the privacy network's funding reserves. The debate intensified after Zcash co-founder Sean Bowe…

VanEck’s new Wealth Builder ETF targets a 2% Bitcoin allocation, with a permitted range of 1% to 5%, gaining exposure through a spot Bitcoin ETP.

More than 40% of the companies initially proposed to have their stocks listed in tokenized form have asked to opt-out.

Stocks on China's mainland have shed about $2.4 trillion since May as investors doubt AI companies can turn a profit, while U.S. restrictions and high U.S. interest rates add pressure.

ETH here means Exponential Time Hypothesis, and a theoretical SAT speed-up alone does not establish a practical cryptographic attack. Read the full story on CryptoSlateUnderstand the crypto stories that matter…

Robinhood’s blockchain boosted crypto revenue, while prediction markets brought in $173 million in the third quarter.

Robinhood posted record revenue of $1.42 billion but earned $0.51 per share, short of the $0.55 expected, as bets on sports and elections grew to $173 million and crypto edged up.
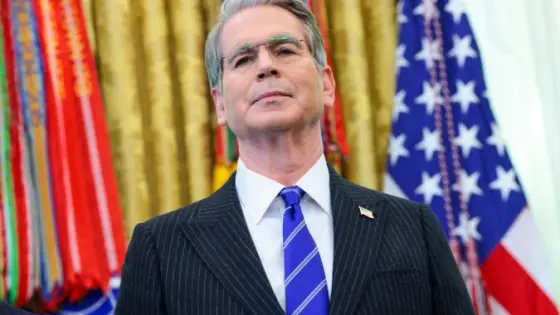
Speaking at Ripple's conference, the U.S. Treasury Secretary said the SEC and CFTC action could help fill the gap left by the Clarity Act's failure, while curbing crypto debanking.

Speaking on Cointelegraph’s Chain Reaction podcast, Muneeb Ali warned that uncertainty over Bitcoin’s quantum security could deter institutional investors.

Crypto trading volume fell 38% from year-ago levels, but the firm's overall blockchain business gained traction.
Ripple's RLUSD stablecoin is live on Robinhood Chain and Bitstamp, and heads to the Robinhood app later this year as the companies deepen ties in treasury and institutional trading.
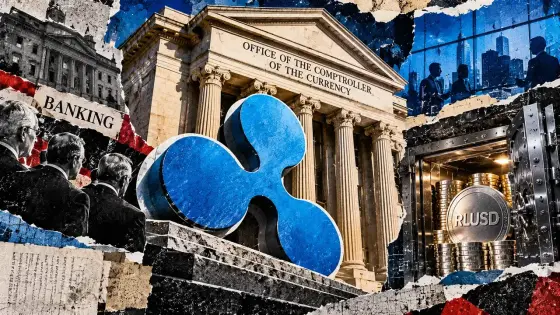
Ripple said it secured final US approval for a national trust bank despite objections from traditional banking groups concerned about crypto firms entering regulated finance. The company announced on Oct. 26…

Ripple also expanded its collaboration with BNY on digital asset custody and partnered with C2FO to bring trade finance settlement onto the XRP Ledger.

Bitcoin Magazine Bitcoin Price Rests Near $80,500 as Midterms, Fed Decision Loom Bitcoin price recovered from an early-morning low near $79,400 to trade around $80,500 on Tuesday, holding above $80,000 ahead…

An expanded deal with Bitso puts Anchorage Digital Bank’s custody beneath both sides of the US-Mexico remittance route.

Need to know what happened in crypto today? Here is the latest news on daily trends and events impacting Bitcoin price, blockchain, DeFi, Web3 and crypto regulation.

The US state filed a lawsuit against Kalshi last week, seeking to recover up to $60 million in profits related to event contracts on prediction markets.

Bitcoin Magazine VanEck Launches All-in-One Wealth Builder ETF With Bitcoin Exposure VanEck launched its Wealth Builder ETF (WBMO) on the NYSE, bundling stocks, bonds, gold and indirect bitcoin exposure into…

Akamai launched a locked box for AI agents on Tuesday. It joins Palo Alto, Cisco, CrowdStrike, Okta and Zscaler in selling protection for software that now acts on its own.
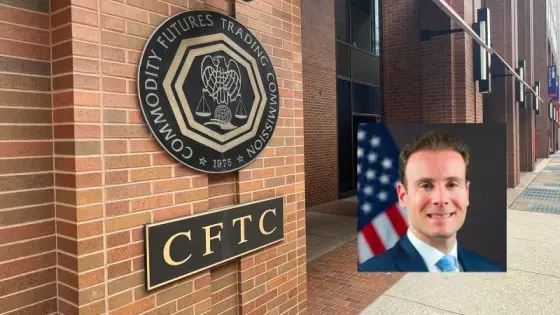
The U.S. Commodity Futures Trading Commission has pursued more than a dozen legal actions to protect what its chief sees as its sole power over prediction markets.

BOLT11 now requires one payment hash and one payment secret, while operators must check how their software records withdrawals. Read the full story on CryptoSlateUnderstand the crypto stories that matter and…

Bitcoin Magazine 27-Year-Old Missouri Man Admits Role in Failed Bitcoin Kidnapping Plot A St. Louis man pleaded guilty in Hartford to conspiracy to commit Hobbs Act robbery over a failed August 2024 plot to…

The CFTC is escalating its legal fight with states, suing Utah after the state filed a lawsuit against prediction market platform Kalshi.
Intel, Oracle, IBM, and IonQ became the latest companies to object to trading of their shares on the planned OKX-ICE tokenized stock venue, bringing the total to 26.

Bitcoin Magazine CFTC Again Probes Polymarket Over Whether It Let Americans Trade The CFTC is reportedly probing whether Polymarket broke its 2022 settlement by letting US users onto its offshore platform…

Attackers obtained the factory key that proves Keystone's hardware wallets are genuine, and 25,964 buyer records were affected. The company says recovery phrases and private keys were not involved.

The latest notice added four objections, bringing the total to 26 as the joint venture prepares to test the SEC’s new framework for blockchain-based stock trading.

The September survey offered a possible window into US voters who could consider fintech and digital asset policies on Election Day.

Chainalysis’s Oct. 26 report tracks a collapse and recovery in activity it classifies as everyday use, while household access remains unmeasured. Read the full story on CryptoSlateUnderstand the crypto stories…
Bitcoin Magazine Next Week’s Midterms Could Stall the CLARITY Act and Test Crypto’s Political Clout: TD Cowen TD Cowen says a Democratic sweep would stall the CLARITY Act, while regulators keep advancing rules…
A collaboration with payments-tech firm ACI Worldwide will pilot folding USDC settlement into Colombia’s instant-payments network.

The contracts have no expiration date and allow traders to bet on crypto prices rising or falling.

The EEA rollout adds USD-settled contracts to existing derivatives accounts, with shared futures collateral and portfolio margin on by default. Read the full story on CryptoSlateUnderstand the crypto stories…

Cancore, a Canton-based trading platform connecting assets on the network with liquidity on public blockchains, has raised $7.2 million in seed funding. Paper Ventures, dao5, ArkStream Capital, X Ventures, MH…
No recent stories match. Try another filter or search.
Crypto Daily Watch
A daily snapshot of the crypto market: prices, sentiment and headlines in one place. Data refreshes every few minutes.
Data sources
Market data by CoinGecko. Bitcoin price history for the rainbow chart and the DCA calculator by Bitstamp. Fear & Greed Index by Alternative.me. US spot Bitcoin ETF flows by TFTC (CC BY 4.0). Headlines belong to their respective publishers (CoinDesk, Cointelegraph, Decrypt, Bitcoin Magazine, The Block, CryptoSlate).
Disclaimer
For information only. Nothing here is financial advice. Crypto assets are volatile – do your own research.
© 2026 Crypto Daily Watch · cryptodailywatch.me
Altcoin Season Index · Bitcoin Rainbow Chart · Bitcoin DCA Calculator · Privacy Policy · Terms of Use ·